
Costing results graphically
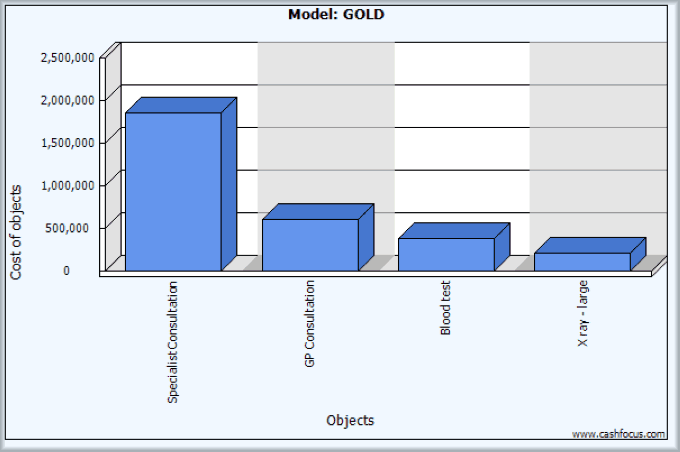
Activity based costing graphs are a standard feature of ABC Focus software for displaying results. They are handy as a visual means of displaying results like cost comparisons for products or services in your business.
Activity based costing graphs are user controlled
You can select what to graph e.g. cost objects, cost pools, processes, cost lines, composite cost objects and revenue. There is also versatility in the choice of how much to display in the graph for example the top 10% of cost lines etc. User input is also possible for graph title, footer and both x and y axis labels.
Graphs can be copied between ABC Focus and other application e.g. Microsoft Word or PowerPoint. For special graphing requirement all the results can be exported to a spreadsheet. The data can then be manipulated as required.