Budget graphics facilitate the analysis of trends and strategies in Visual Cash Focus forecasts and budgets.
All editions of Visual Cash Focus have built in graphics for analyzing trends and strategies in budgets or forecasts.
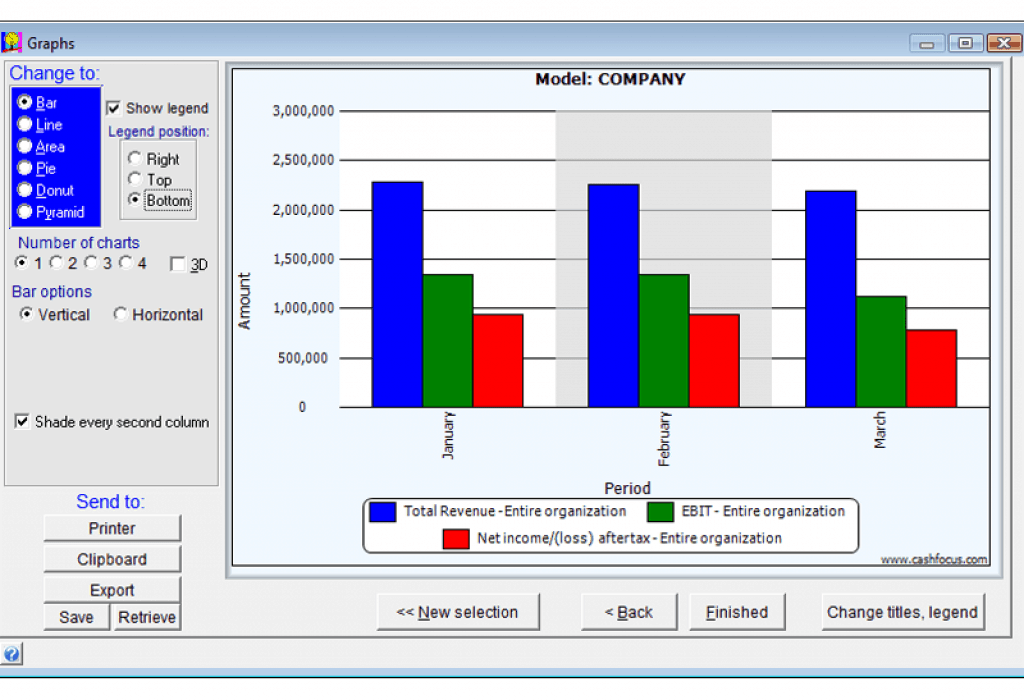
Most graphs plot amounts for each period in the budget. The default names for each axis can be changed if required.
Items from the Profit and loss and Balance sheet can be plotted on the same graph e.g. accounts receivable from the balance sheet versus Total sales from the Profit and loss. Actuals can be included. If profit centers are in use, then you can choose which budget profit centers to include.