
Financial Analysis Report Graphs
The user chooses what to include in the Strategic Focus financial analysis report graphs.
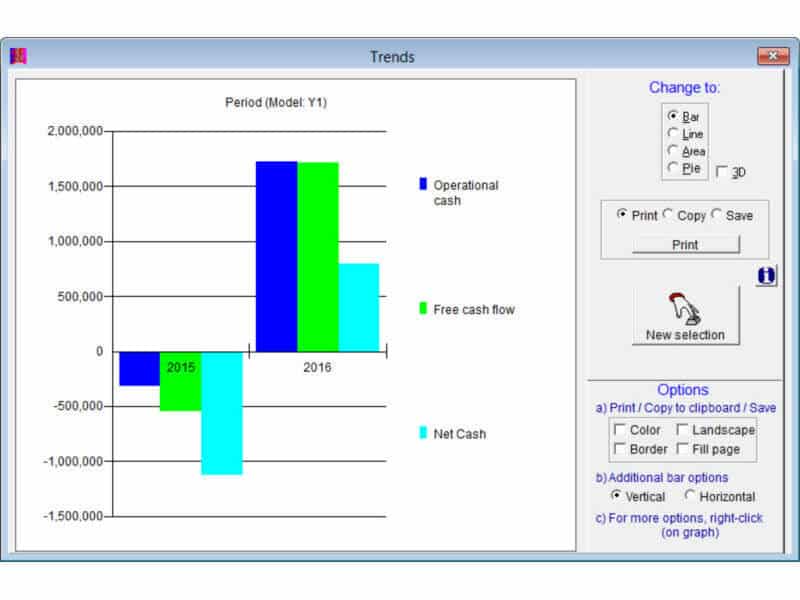
Strategic Focus tracks profit and cash flows through the income statement (profit and loss) and balance sheet. The results include financial analysis report graphs and flowcharts for analysis. For instance, in the graph above you can view the relationship between operational cash, free cash flow and net cash and see how cash flows form the foundation for returning dividends to shareholders or add real value to their investment. There is high degree of flexibility for users to produce graphic representations of configurations from the Balance sheet and Income statement accounts and from both the Finance and Operations sections.