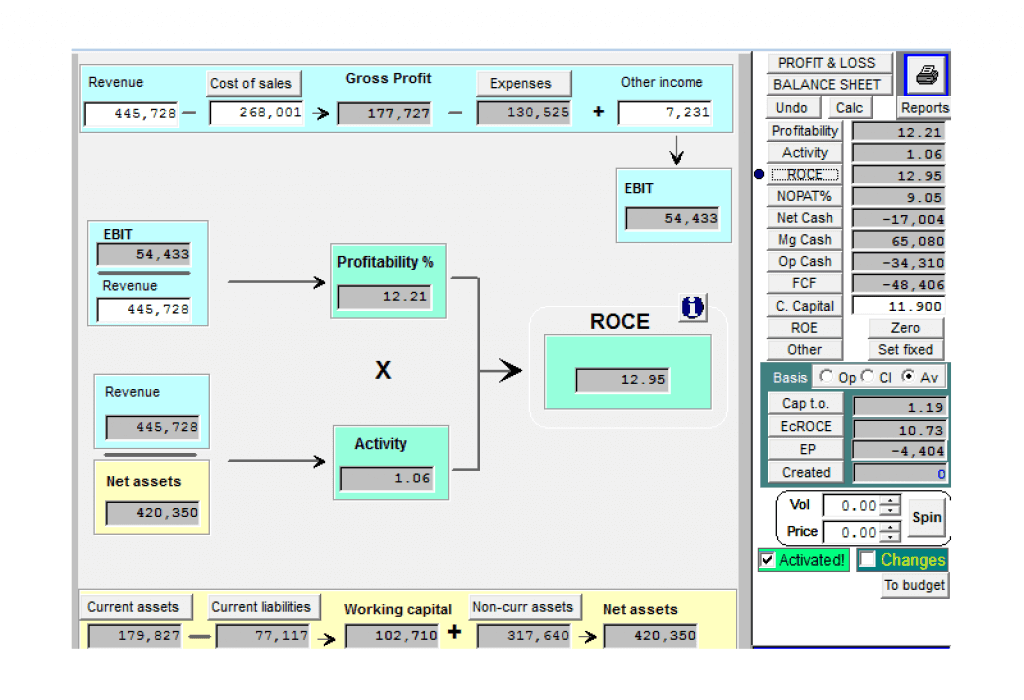
Strategic Focus provides a standard platform for financial statement analysis and business valuations. Flow charts facilitate understanding of key performance measures, indicators and financial ratios like ROCE as shown here.
Strategic Focus can analyze financial results with many financial ratios of which ROCE is one of the most well known and popular. See how ROCE or return on capital employed is derived.
The ROCE ratio calculation contains components from both the Income statement (Profit & Loss) and Balance sheet. These contributors from the different financial statements display separately. Then the cumulative outcome from both combine into the ratio calculation. Here the ROCE ratio is calculated at 12.95.
Investigate the current financial performance and also evaluate alternative strategies for their impact on business value. With What-if analysis endless possibilities can be tested and the outcomes compared. Tinkering with performance drivers can vary the values of relevant ratios. For instance ROCE can be optimised for suitability for a particular business environment.
Financial statement analysis with both financial and non financial ratios
Some ratios like ROCE come standard with the package but you can also add and define your own. The software allows both financial ratios and non-financial ratios for example you can have ratios like $ of sales per person or $ of costs per m² etc.
